


Transforming Real Estate Search with Knowledge Graphs: A Technical Deep Dive
Introduction
In today’s digital landscape, we’re drowning in data but starving for insights. This is especially true in real estate, where buyers and renters navigate through millions of listings, each containing dozens of attributes, images, descriptions, and location details. The challenge isn’t finding information — it’s organizing it in a way that makes sense and delivers value to users searching for their dream home.
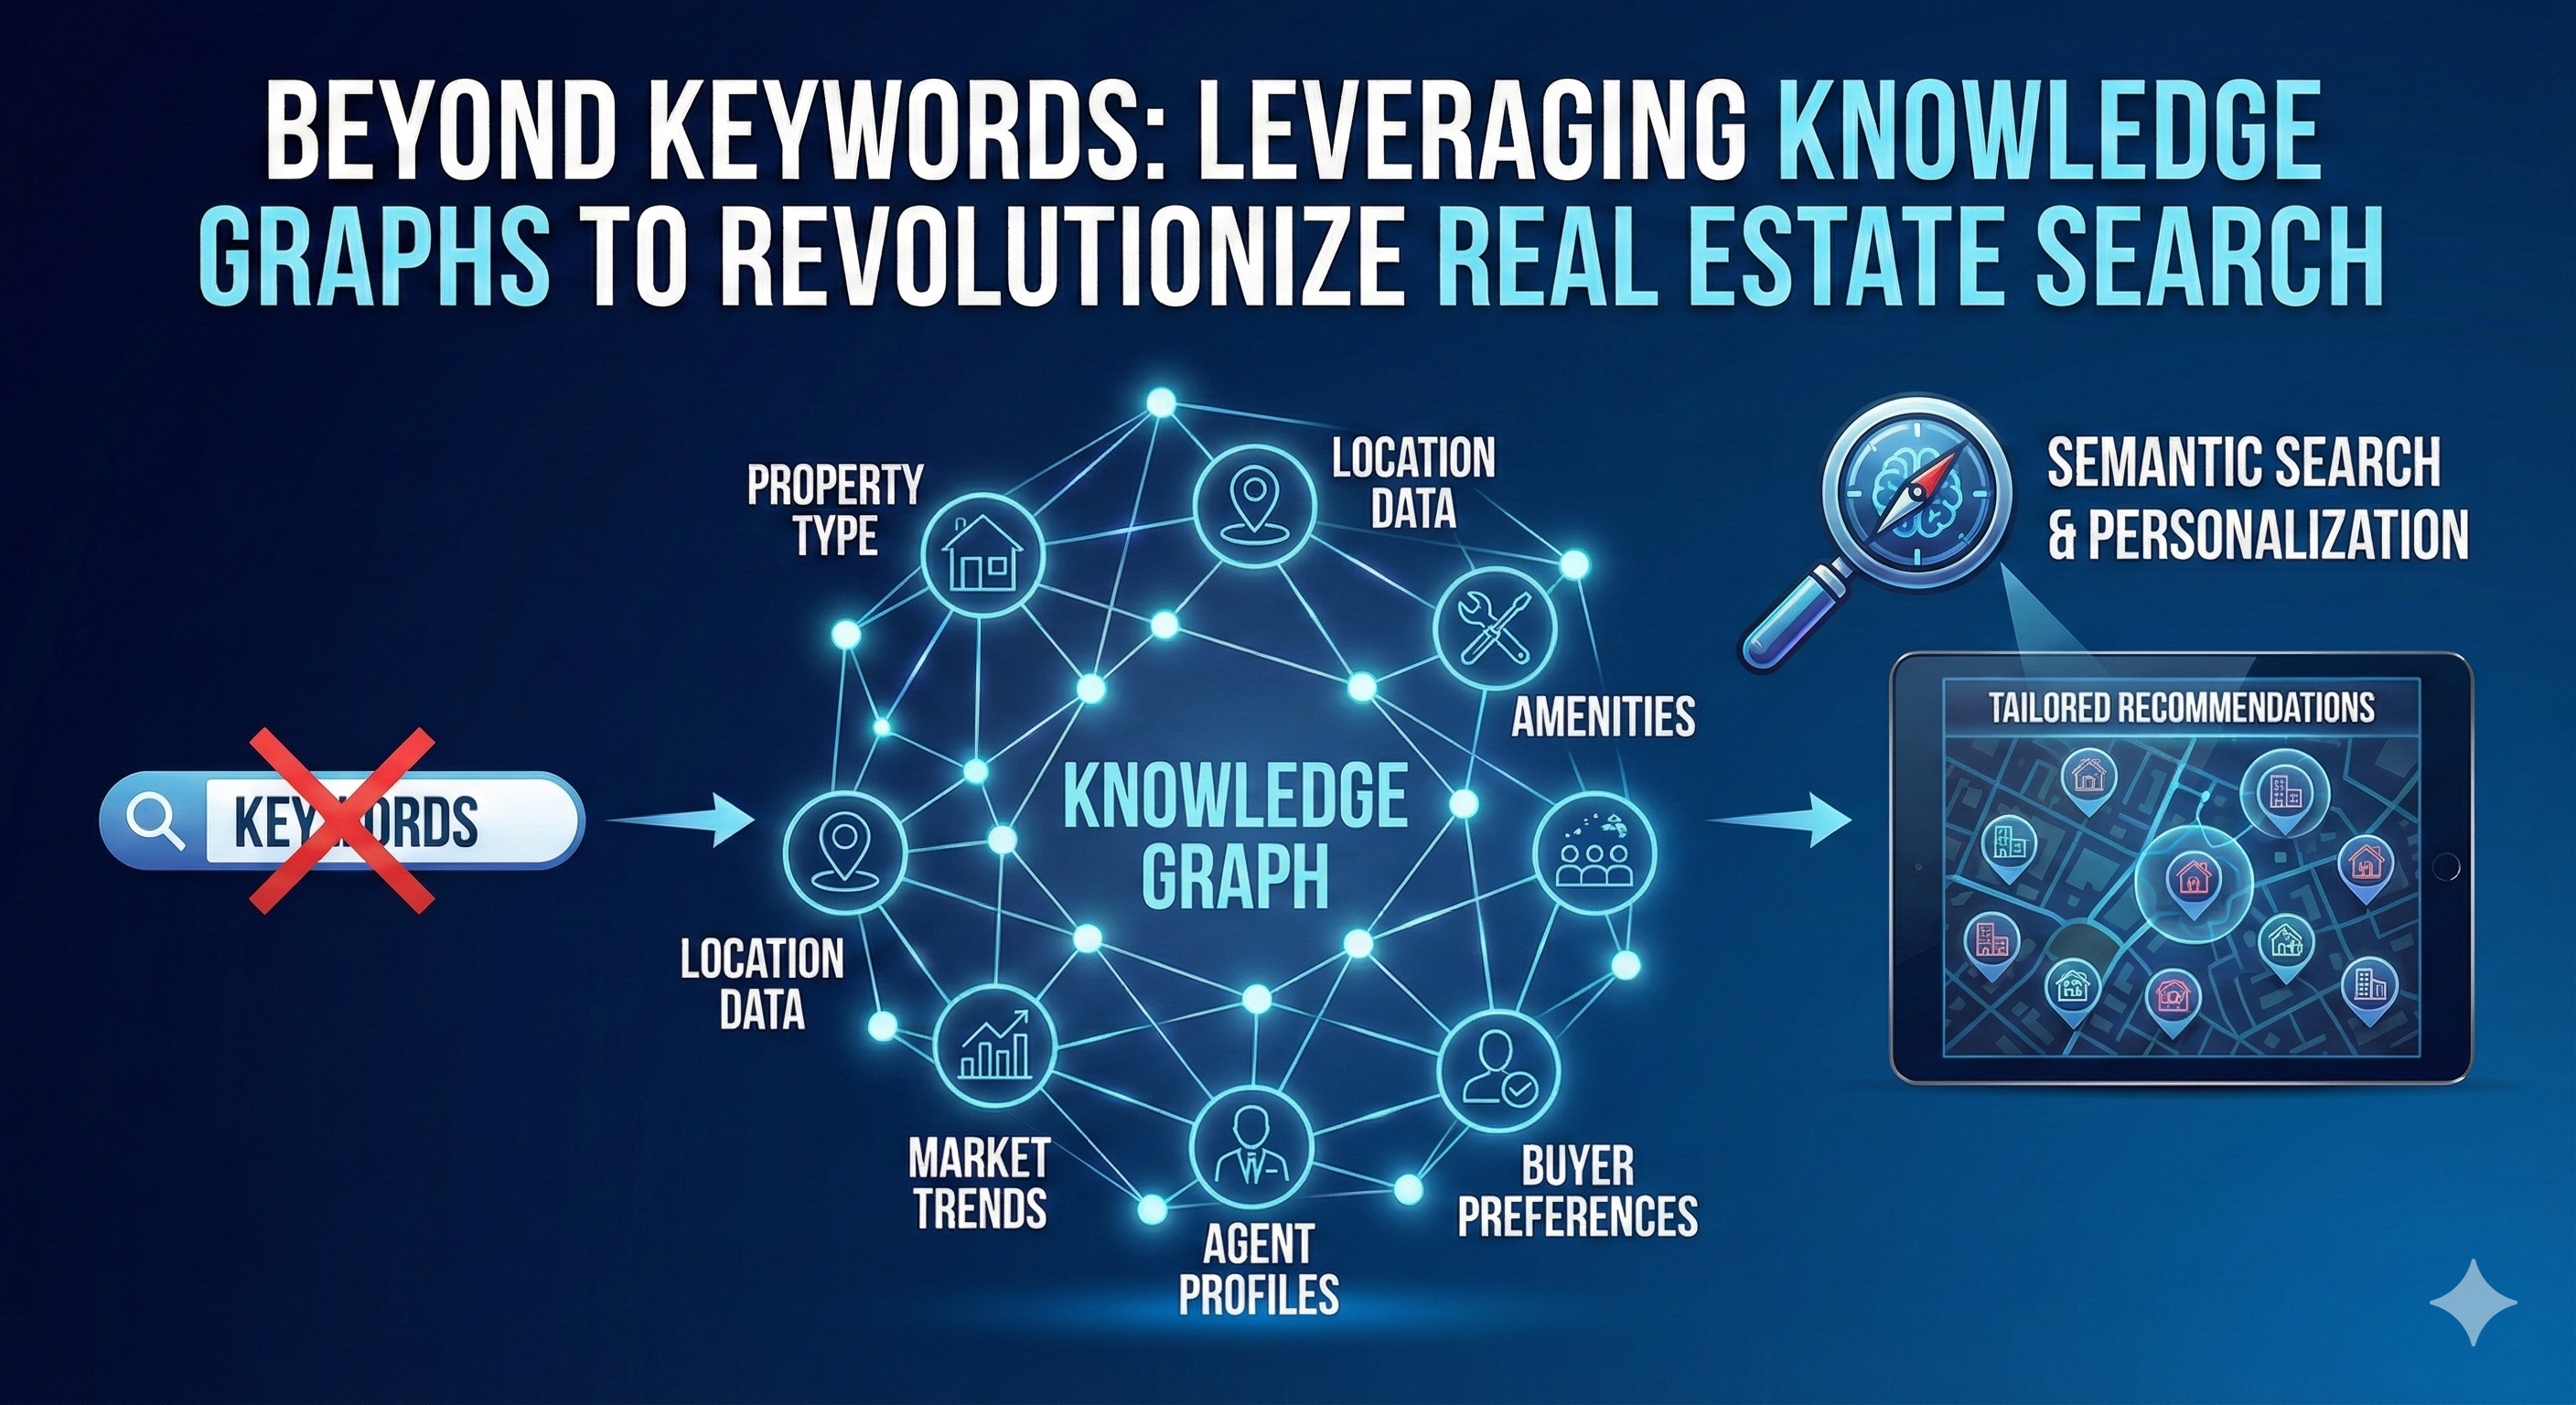
Enter knowledge graphs: a powerful framework for structuring information, capturing relationships between data points, and making complex datasets both human- and machine-readable. In this post, I’ll share how our team built and deployed a real estate knowledge graph that transformed our search experience and unlocked entirely new product capabilities.
The Challenge: Too Much Data, Not Enough Structure
Real estate platforms deal with an overwhelming variety of data sources:
- Structured data: Property specifications from MLS feeds, agent inputs, regional information, and user interaction logs
- Unstructured data: Listing descriptions, property images, 3D tours, floor plans, and scanned documents
The core problem? The same concept appears in countless variations across these sources. A “pool” might show up as “pool,” “swimming pool,” “swimmingpool,” or “has_pool: True” depending on the data source. Users searching for “NYC apartments” and “New York City apartments” are looking for the same thing, but traditional keyword matching would treat these as completely different queries.
Without a unified understanding of these concepts and their relationships, we couldn’t deliver consistent, relevant search results or understand what users truly wanted.
Why Knowledge Graphs?
Knowledge graphs solve the organization problem by creating a structured network of entities and their relationships. Think of it as a semantic layer on top of your data that captures not just what things are, but how they relate to each other.
For example, in our real estate knowledge graph:
- “Pool” is synonymous with “swimming pool”
- “Heated pool” is a child concept of “pool”
- “Pool” is related to “outdoor amenities”
- “Outdoor amenities” connects to “backyard” and “patio”
This web of relationships enables machines to understand context and intent in ways that simple keyword matching never could.
Architecture: From Raw Data to Actionable Intelligence
Our knowledge graph system consists of three main components:
1. Content Understanding Platform
We built an internal platform that serves as the bridge between raw data sources and our knowledge graph. This platform:
- Aggregates data from multiple structured and unstructured sources
- Runs AI/ML models for information extraction
- Normalizes concepts to a canonical vocabulary
- Incorporates human-in-the-loop validation for quality assurance
- Makes near real-time predictions for supported use cases
2. Knowledge Extraction Pipeline
We extract valuable information from various sources using a combination of statistical models and transformer-based neural networks:
From Listing Descriptions: Using NLP and information extraction techniques, we identify important home attributes mentioned in natural language text. For instance, from “This charming bungalow features hardwood floors throughout and a recently renovated chef’s kitchen with granite countertops,” we extract concepts like: hardwood floors, bungalow architecture, renovated kitchen, granite countertops, and chef’s kitchen.
From Images: Computer vision models analyze property photos to identify scenes, assess image quality, and detect specific attributes. We can recognize features like “open floor plan,” “vaulted ceilings,” or “modern appliances” directly from images — even when these details aren’t mentioned in the listing description.
From User Queries: We analyze both natural language searches (“homes near me with 2 beds 2 baths and a fireplace”) and keyword searches to understand user preferences and discover new ways people express the same concepts. SEO queries from search engines provide additional insights into search patterns.
3. Ontology Design
We developed a standardized ontology that defines:
- Node types: Home concepts (pool, architecture styles, amenities), base forms (raw text entities), listings, agents, locations
- Relationship types: Parent/child (hypernym/hyponym), synonyms, part-of, located-near
- Metadata: Concept definitions, usage guidelines, annotation standards
This ontology serves as the foundation for how we store and query information in the graph.
The Technical Details: Building the Graph
Normalization and Entity Disambiguation
One of our biggest challenges was handling the many forms a single concept can take. We use a two-pronged approach:
Static Mapping Lists: We maintain curated lists of known variations for each concept. This approach is fast and offers excellent quality control but requires constant updates and struggles with out-of-vocabulary terms.
ML-Based Disambiguation: We trained BERT-based models to identify synonyms and link new entities to existing graph nodes. Given a pair of phrases, our model classifies whether they’re synonyms. This approach handles novel variations and can also expand our static lists automatically.
Our models achieve impressive performance:
- Synonym detection: 94.2% precision, 91.8% recall
- Parent-child relationship detection: 92.7% precision, 89.3% recall
Discovering Relationships
Connecting nodes with meaningful relationships is where the knowledge graph becomes truly powerful. We use different methods depending on the relationship type:
For parent-child and synonym relationships, we developed a two-stage process:
- Candidate Generation: An in-domain SBERT model generates embeddings for all concepts and identifies nearest neighbors as potential candidates. This reduces the computational cost of comparing every possible pair.
- Pairwise Classification: A BERT-based classifier evaluates each candidate pair to predict the specific relationship type (synonym, parent, child, or none).
- Human Verification: High-confidence predictions are auto-accepted, while edge cases go through human review to maintain quality.
This approach lets us automatically discover relationships like “fenced backyard” being a child concept of “backyard,” or “chef’s kitchen” being synonymous with “gourmet kitchen.”
Updates and Versioning
A knowledge graph is never finished — it’s a living system that evolves with new data. We handle two types of updates:
Point-wise Updates: Localized changes like new listing descriptions, added images, or newly discovered base forms. These have limited scope and can be deployed quickly.
Knowledge Base Updates: Broader changes affecting many nodes, such as ontology modifications, new relationship types, or updates to concept hierarchies. These require careful coordination with downstream consumers and extensive testing.
We maintain time-based versioning, allowing multiple versions to coexist. This gives product teams flexibility to migrate at their own pace while we track the impact of each release.
Real-World Applications: How It Powers User Experiences
The knowledge graph enables several critical product features:
1. Search Query Autocomplete
As users type, we suggest relevant concepts from the graph — whether they’re amenities, architectural styles, or location-based features. The graph ensures suggestions are relevant and comprehensive.
2. Concept-Based Keyword Search
Instead of simple text matching, we normalize user queries to canonical concepts. Someone searching for “swimming pool” gets the same results as “pool” or “has pool” — and we can intelligently show homes with related child concepts like “heated pool” or “infinity pool.”
3. Natural Language Query Understanding
When users enter complex queries like “3 bedroom homes with a fireplace near good schools,” we parse the query into structured components using the knowledge graph. Each element maps to specific concepts that drive accurate filtering and ranking.
4. Enhanced User Profiles
We build richer user profiles by tracking interactions with specific graph concepts. If someone repeatedly views homes with “hardwood floors” and “open floor plans,” we capture these preferences at the concept level — not just the keyword level — enabling more accurate personalization.
The Results: Measurable Impact
Implementing the knowledge graph delivered significant improvements across multiple metrics:
- Launch of Natural Language Search: We became the first in our industry to support full natural language queries
- Expanded Inventory Access: Significant increase in properties shown for keyword searches due to better concept matching
- Improved Query Understanding: More accurate parsing of user intent across diverse phrasings
- Better Relevance: Higher relevance scores for properties shown to users, validated through A/B testing
- Enhanced User Understanding: Deeper insights into user preferences enabling better search algorithms and ranking models
These improvements translated to measurable lifts in customer experience metrics and increased engagement across our platform.
Key Lessons Learned
Building a production knowledge graph for real estate taught us several valuable lessons:
- Start with Clear Use Cases: Don’t build a knowledge graph for its own sake. We began with specific product needs (natural language search, query understanding) and expanded from there.
- Balance Automation and Human Oversight: ML models are powerful, but human validation is crucial for quality — especially for relationship discovery and entity disambiguation.
- Design for Evolution: Your ontology and graph structure will change. Build versioning and migration paths from day one.
- Invest in Tooling: The Content Understanding Platform was critical infrastructure. Build the tools that make it easy for teams to extract, validate, and consume knowledge graph data.
- Communicate Changes: Knowledge base updates affect multiple teams. Over-communicate changes and give consumers time to adapt.
Looking Forward
Our knowledge graph journey is far from over. We’re exploring several exciting directions:
- Expanding to capture neighborhood characteristics, school quality, and local points of interest
- Incorporating temporal relationships (e.g., market trends, seasonal patterns)
- Building more sophisticated reasoning capabilities for complex user needs
- Enhancing multimodal understanding by better linking text, image, and structured data concepts
Conclusion
Knowledge graphs represent a fundamental shift in how we organize and leverage data. By moving beyond simple keyword matching to understanding concepts and relationships, we’ve unlocked richer search experiences, better personalization, and entirely new product capabilities.
For teams working with complex, multi-source datasets — whether in real estate, e-commerce, healthcare, or any other domain — knowledge graphs offer a powerful framework for turning data chaos into actionable intelligence. The initial investment is substantial, but the long-term benefits in product capability and user experience make it well worth the effort.
From Conversational Data to Real-World AI Impact
At ElevateTrust.ai, we build AI systems that go far beyond dashboards, demos, and proofs of concept — into production-grade, business-critical deployments.
We help organizations turn AI vision into real execution through:
- AI-powered Video Analytics & Computer Vision
- Edge AI, Cloud, and On-Prem deployments
- Custom detection models tailored to industry-specific requirements
From attendance automation and workplace safety to intelligent surveillance and monitoring, our solutions are designed to scale reliably in real-world environments — where accuracy, latency, and trust truly matter.
Just as conversational AI agents are transforming how teams interact with data, we focus on building AI systems that understand context, operate at scale, and deliver measurable business outcomes.
Book a free consultation or DM us to get started
https://elevatetrust.ai
Let’s build AI that doesn’t just watch — it understands.
